
What Is a Good PSAT Score? 2026 Percentiles, Benchmarks & National Merit Cutoffs
PSAT scores from the October 2026 test are arriving now. Here is how to read yours: what counts as a good score in 10th and 11th grade, the official percentiles, the benchmarks that show you are on track, and the Selection Index you need for National Merit.
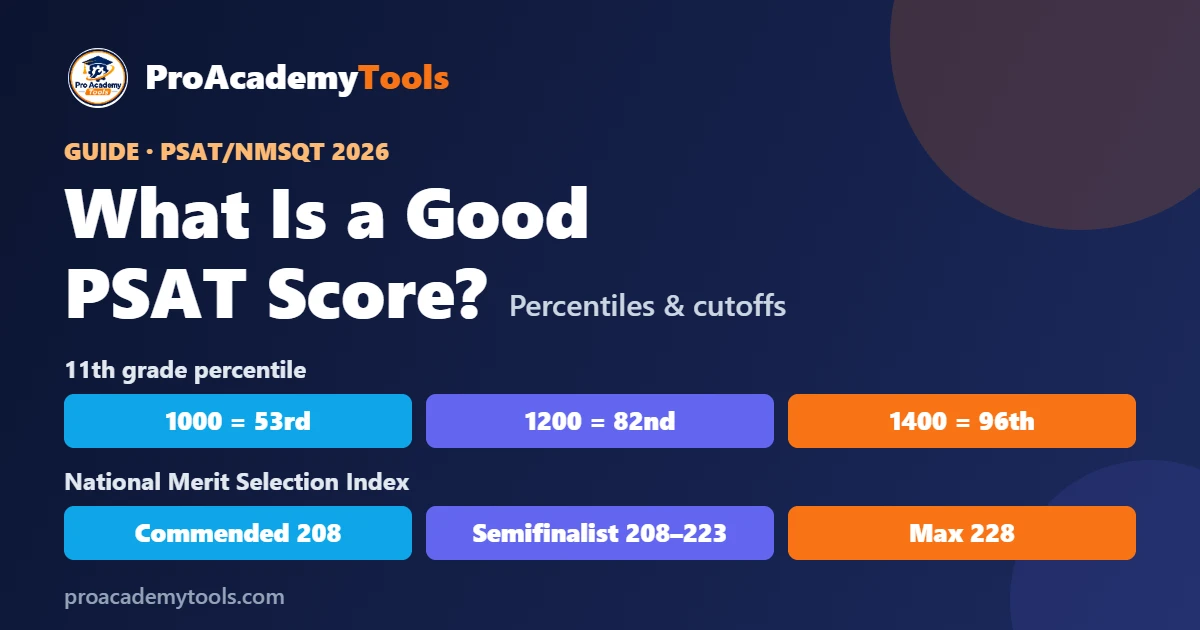
The PSAT/NMSQT is scored from 320 to 1520. For an 11th grader, a 1000 is about average (53rd percentile), 1200 is good (82nd), 1300 is very good (91st) and 1400+ is excellent (96th+). For a 10th grader, 1100 is already the 82nd percentile. On track for college readiness means at least 460 in Reading and Writing and 510 in Math in 11th grade. For National Merit, juniors need a Selection Index of 208–223 depending on their state (class of 2027 cutoffs).
PSAT score range at a glance
| Score range | |
|---|---|
| Total score | 320–1520 |
| Reading and Writing | 160–760 |
| Math | 160–760 |
| National Merit Selection Index | 48–228 |
The PSAT uses the same kind of scale as the SAT but tops out at 1520 instead of 1600, because it is designed for 10th and 11th graders.
What is a good PSAT score? (official percentiles)
These are College Board’s user group percentiles — the share of recent test takers in your grade who scored at or below each score:
| Total PSAT score | 11th grade percentile | 10th grade percentile | How it is usually viewed |
|---|---|---|---|
| 1520 | 99+ | 99+ | Perfect score |
| 1450 | 98 | 99+ | Exceptional — National Merit range in most states |
| 1400 | 96 | 99 | Excellent |
| 1350 | 94 | 98 | Excellent |
| 1300 | 91 | 97 | Very good |
| 1250 | 87 | 95 | Very good |
| 1200 | 82 | 92 | Good |
| 1150 | 76 | 87 | Good |
| 1100 | 69 | 82 | Above average |
| 1050 | 61 | 76 | Slightly above average |
| 1000 | 53 | 69 | About average (11th grade) |
| 950 | 44 | 60 | Slightly below average |
| 900 | 36 | 51 | About average (10th grade) |
| 800 | 19 | 30 | Below average |
A simple rule: in 11th grade, anything above 1000 is above average and 1200+ puts you in roughly the top fifth. In 10th grade, the same score ranks higher because most students have one more year of learning ahead.
Section score percentiles
| Section score | 11th grade Reading & Writing | 11th grade Math | 10th grade Reading & Writing | 10th grade Math |
|---|---|---|---|---|
| 700 | 96 | 95 | 99 | 99 |
| 650 | 88 | 91 | 95 | 97 |
| 600 | 78 | 84 | 88 | 92 |
| 550 | 65 | 73 | 78 | 85 |
| 500 | 49 | 58 | 64 | 72 |
| 450 | 33 | 40 | 47 | 55 |
Are you on track? College Board benchmarks
College Board sets grade-level benchmarks — the section scores that show you are on track for college and career readiness:
| Grade | Reading and Writing | Math |
|---|---|---|
| 10th grade (PSAT 10 / PSAT/NMSQT) | 430 | 480 |
| 11th grade (PSAT 10 / PSAT/NMSQT) | 460 | 510 |
| SAT (any grade) | 480 | 530 |
Meeting a benchmark is a minimum target, not a cut-off for “good”. Your score report marks each section green (meets), yellow (approaching) or red (needs strengthening).
National Merit: the Selection Index explained
Juniors who take the PSAT/NMSQT enter the National Merit Scholarship Program. Qualification uses the Selection Index (SI), which weights Reading and Writing twice:
Selection Index = (2 × Reading and Writing + Math) ÷ 10
Example: 720 Reading and Writing + 700 Math → (1,440 + 700) ÷ 10 = 214. The maximum is 228.
- Commended Students: the class of 2027 cutoff was a Selection Index of 208 (down from 210 for the class of 2026).
- Semifinalists: about 16,000 students, chosen state by state, so the cutoff depends on where you live.
National Merit semifinalist cutoffs by state (class of 2027)
These cutoffs were announced in September 2026 for students who took the PSAT/NMSQT in October 2025:
| State | 2027 | 2026 | State | 2027 | 2026 |
|---|---|---|---|---|---|
| Alabama | 210 | 214 | Montana | 208 | 213 |
| Alaska | 208 | 215 | Nebraska | 212 | 214 |
| Arizona | 215 | 218 | Nevada | 211 | 214 |
| Arkansas | 210 | 215 | New Hampshire | 215 | 219 |
| California | 220 | 224 | New Jersey | 223 | 225 |
| Colorado | 217 | 219 | New Mexico | 209 | 210 |
| Connecticut | 220 | 223 | New York | 220 | 223 |
| Delaware | 219 | 220 | North Carolina | 217 | 220 |
| District of Columbia | 223 | 225 | North Dakota | 208 | 210 |
| Florida | 216 | 219 | Ohio | 216 | 219 |
| Georgia | 217 | 220 | Oklahoma | 210 | 212 |
| Hawaii | 218 | 219 | Oregon | 216 | 219 |
| Idaho | 211 | 215 | Pennsylvania | 219 | 221 |
| Illinois | 218 | 222 | Rhode Island | 213 | 219 |
| Indiana | 215 | 218 | South Carolina | 212 | 215 |
| Iowa | 210 | 214 | South Dakota | 210 | 211 |
| Kansas | 212 | 216 | Tennessee | 214 | 219 |
| Kentucky | 211 | 214 | Texas | 219 | 222 |
| Louisiana | 211 | 216 | Utah | 209 | 213 |
| Maine | 214 | 217 | Vermont | 212 | 216 |
| Maryland | 221 | 224 | Virginia | 221 | 224 |
| Massachusetts | 221 | 225 | Washington | 221 | 224 |
| Michigan | 216 | 220 | West Virginia | 208 | 210 |
| Minnesota | 214 | 219 | Wisconsin | 212 | 215 |
| Mississippi | 211 | 213 | Wyoming | 208 | 210 |
| Missouri | 214 | 217 | Studying abroad | 223 | 225 |
Took the PSAT in October 2026? You are in the class of 2028. Your cutoffs will be announced in September 2027 and move a few points each year, so use the table above as a guide — a Selection Index at or above last year’s cutoff for your state gives you a strong chance.
When do PSAT scores come out?
For fall 2026 in-school testing, College Board releases scores to students about two weeks after the answers are submitted:
| Answers submitted | Scores available to students |
|---|---|
| By October 9, 2026 | October 22, 2026 |
| By October 23, 2026 | November 5, 2026 |
| By October 30, 2026 | November 12, 2026 |
If your school tests as part of a state programme, check with your school for its release date. Scores appear in your College Board account and in the BigFuture School app.
What your PSAT score means for the SAT
The PSAT and SAT are on aligned scales, so your PSAT total is a good estimate of the SAT score you would earn if you took the SAT at the same time. Most students improve between the PSAT and the SAT through practice and another semester of coursework.
- Use your PSAT report’s question-level feedback to find skill gaps.
- Take a full digital practice test in Bluebook, then estimate the result with our SAT score calculator.
- Compare with the ACT using the ACT score calculator — some students score noticeably better on one test.
- See where your score stands for admissions in our guide to what a good SAT score is.
Scores are only part of the picture: colleges weigh your grades and course rigor heavily, so also check your weighted and unweighted GPA.
Frequently asked questions
What is a good PSAT score for a junior?
For an 11th grader, a 1000 is about average (53rd percentile), 1200 is good (82nd percentile), 1300 is very good (91st) and 1400 or higher is excellent (96th+).
What is a good PSAT score for a sophomore?
For a 10th grader, a 900 is about average (51st percentile), 1100 is good (82nd), 1200 is very good (92nd) and 1300 or higher is excellent (97th+).
What PSAT score do you need for National Merit?
National Merit uses the Selection Index, (2 × Reading and Writing + Math) ÷ 10. For the class of 2027, Commended required 208 and Semifinalist cutoffs ranged from 208 to 223 depending on the state.
What is the highest PSAT score?
The highest PSAT/NMSQT total score is 1520, with 760 in each section. The highest Selection Index is 228.
Is the PSAT score the same as the SAT score?
They are on aligned scales, so the PSAT predicts the SAT score you would earn if you took it at the same time, but the PSAT tops out at 1520 instead of 1600.
When do October 2026 PSAT scores come out?
For in-school testing, scores reach students about two weeks after answers are submitted: October 22, November 5 or November 12, 2026, depending on the submission date.
Sources and methodology
Percentiles are College Board user group percentiles (students who tested in the past three school years). State cutoffs are the class of 2027 Semifinalist Selection Index values released by NMSC in September 2026, as compiled by Compass Education Group. Data checked November 3, 2026.
- College Board Research — PSAT/NMSQT user percentiles
- College Board — SAT Suite benchmarks
- College Board — SAT Suite score release dates
- Compass Education Group — National Merit Semifinalist cutoffs, class of 2027 (from NMSC data)
Reviewed by the ProAcademy Tools editorial team. Found an error? Tell us — we correct mistakes quickly.